Drought Central, Drought Observatory by CNR IBE
Drought Situation
Some content are available only in Italian
- Ramona Magno
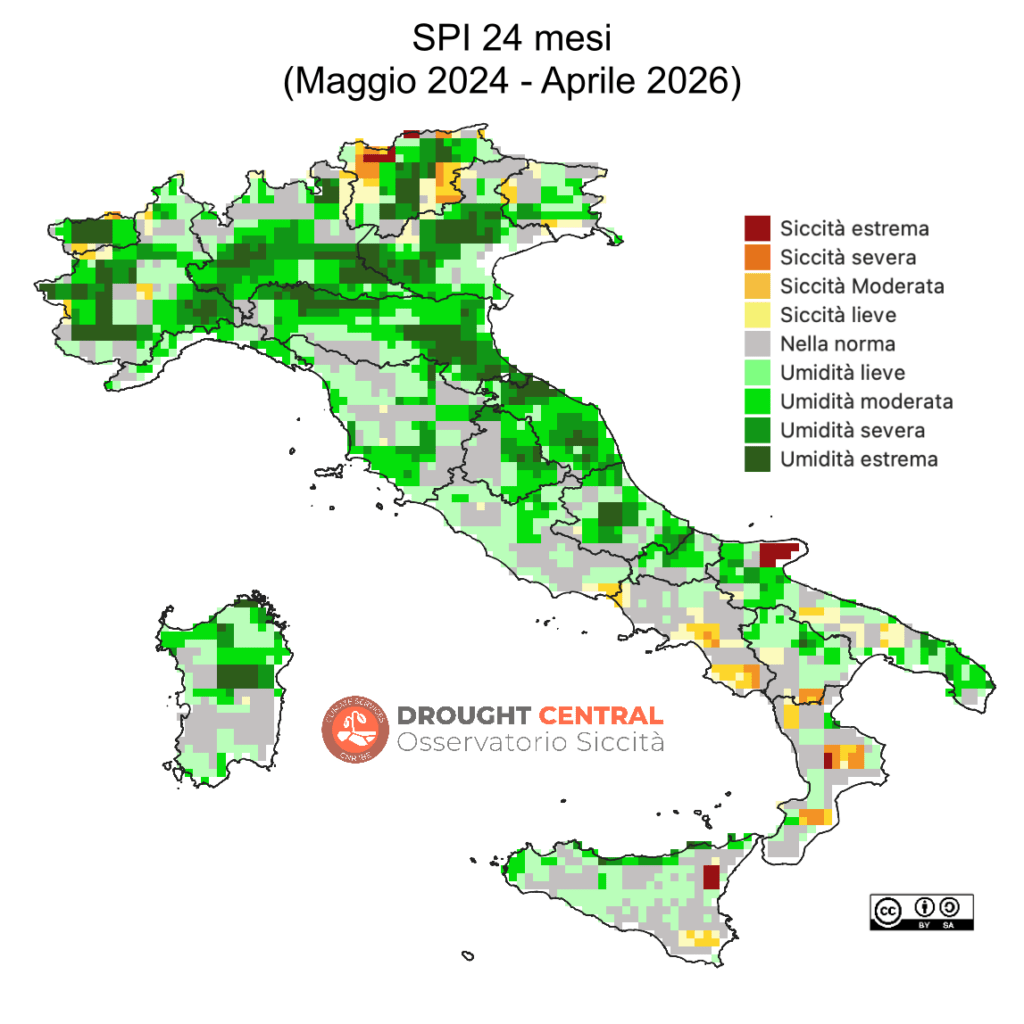
- Gli apporti nevosi, in termini di Equivalente Idrico Nivale (SWE) ad Aprile mostrano un rapido calo, soprattutto nella seconda metà del mese, dovuto alle temperature sopra media e le scarse piogge. A livello italiano la prima decade di Maggio chiude con -48%, al di sotto anche dei valori del 2025. Sull’Appennino la variabilità è ancora maggiore, passando da un forte surplus dei primi di Aprile a valori in media a inizio Maggio (CIMA Foundation).
- Invasi: Le piogge di Aprile sul versante adriatico centro-meridionale e ionico hanno aumentato ulteriormente i livelli degli invasi anche se in maniera non omogenea fra Puglia e Basilicata. In Sicilia e Sardegna le percentuali di riempimento medio sono fra l’85% e il 90%.
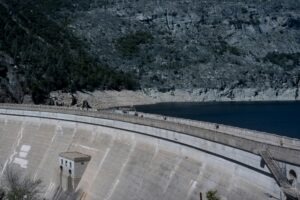
- Grandi laghi del nord Italia: il lago Maggiore rimane al di sopra del limite massimo di regolazione, aumentato per far fronte alla scarsa stagione nevosa e prepararsi ai prossimi mesi estivi. Anche i livelli di Como ed Iseo sono sopra media, mentre il Garda risulta di poco inferiore.
Previsioni per i prossimi mesi
Per quanto riguarda le temperature dell’aria del trimestre estivo Giugno-Agosto 2026, i dati d’insieme dei maggiori centri europei per le previsioni a medio termine danno un segnale positivo su tutta Europa, con le probabilità più alte (70-100%) sulla porzione Mediterranea ed Europa centro-orientale. Anche le temperature superficiali del Mar Mediterraneo continueranno a mantenersi sopra la media. Le piogge, anche se con probabilità fra il 40 e 50%, dovrebbero essere inferiori alla media sull’Europa centrale e orientale, mentre potrebbero risultare superiori sulle regioni Mediterranee occidentali.Drought WebGIS
A WebGIS application based on open source solutions customized to integrate different datasets and share maps and graphs of drought indices with researchers, decision-makers and other stakeholders.
Different functions allow to select sections of territory or visualize the trend of the indices in a specific pixel.
Maps and graphs can also be downloaded in png format.
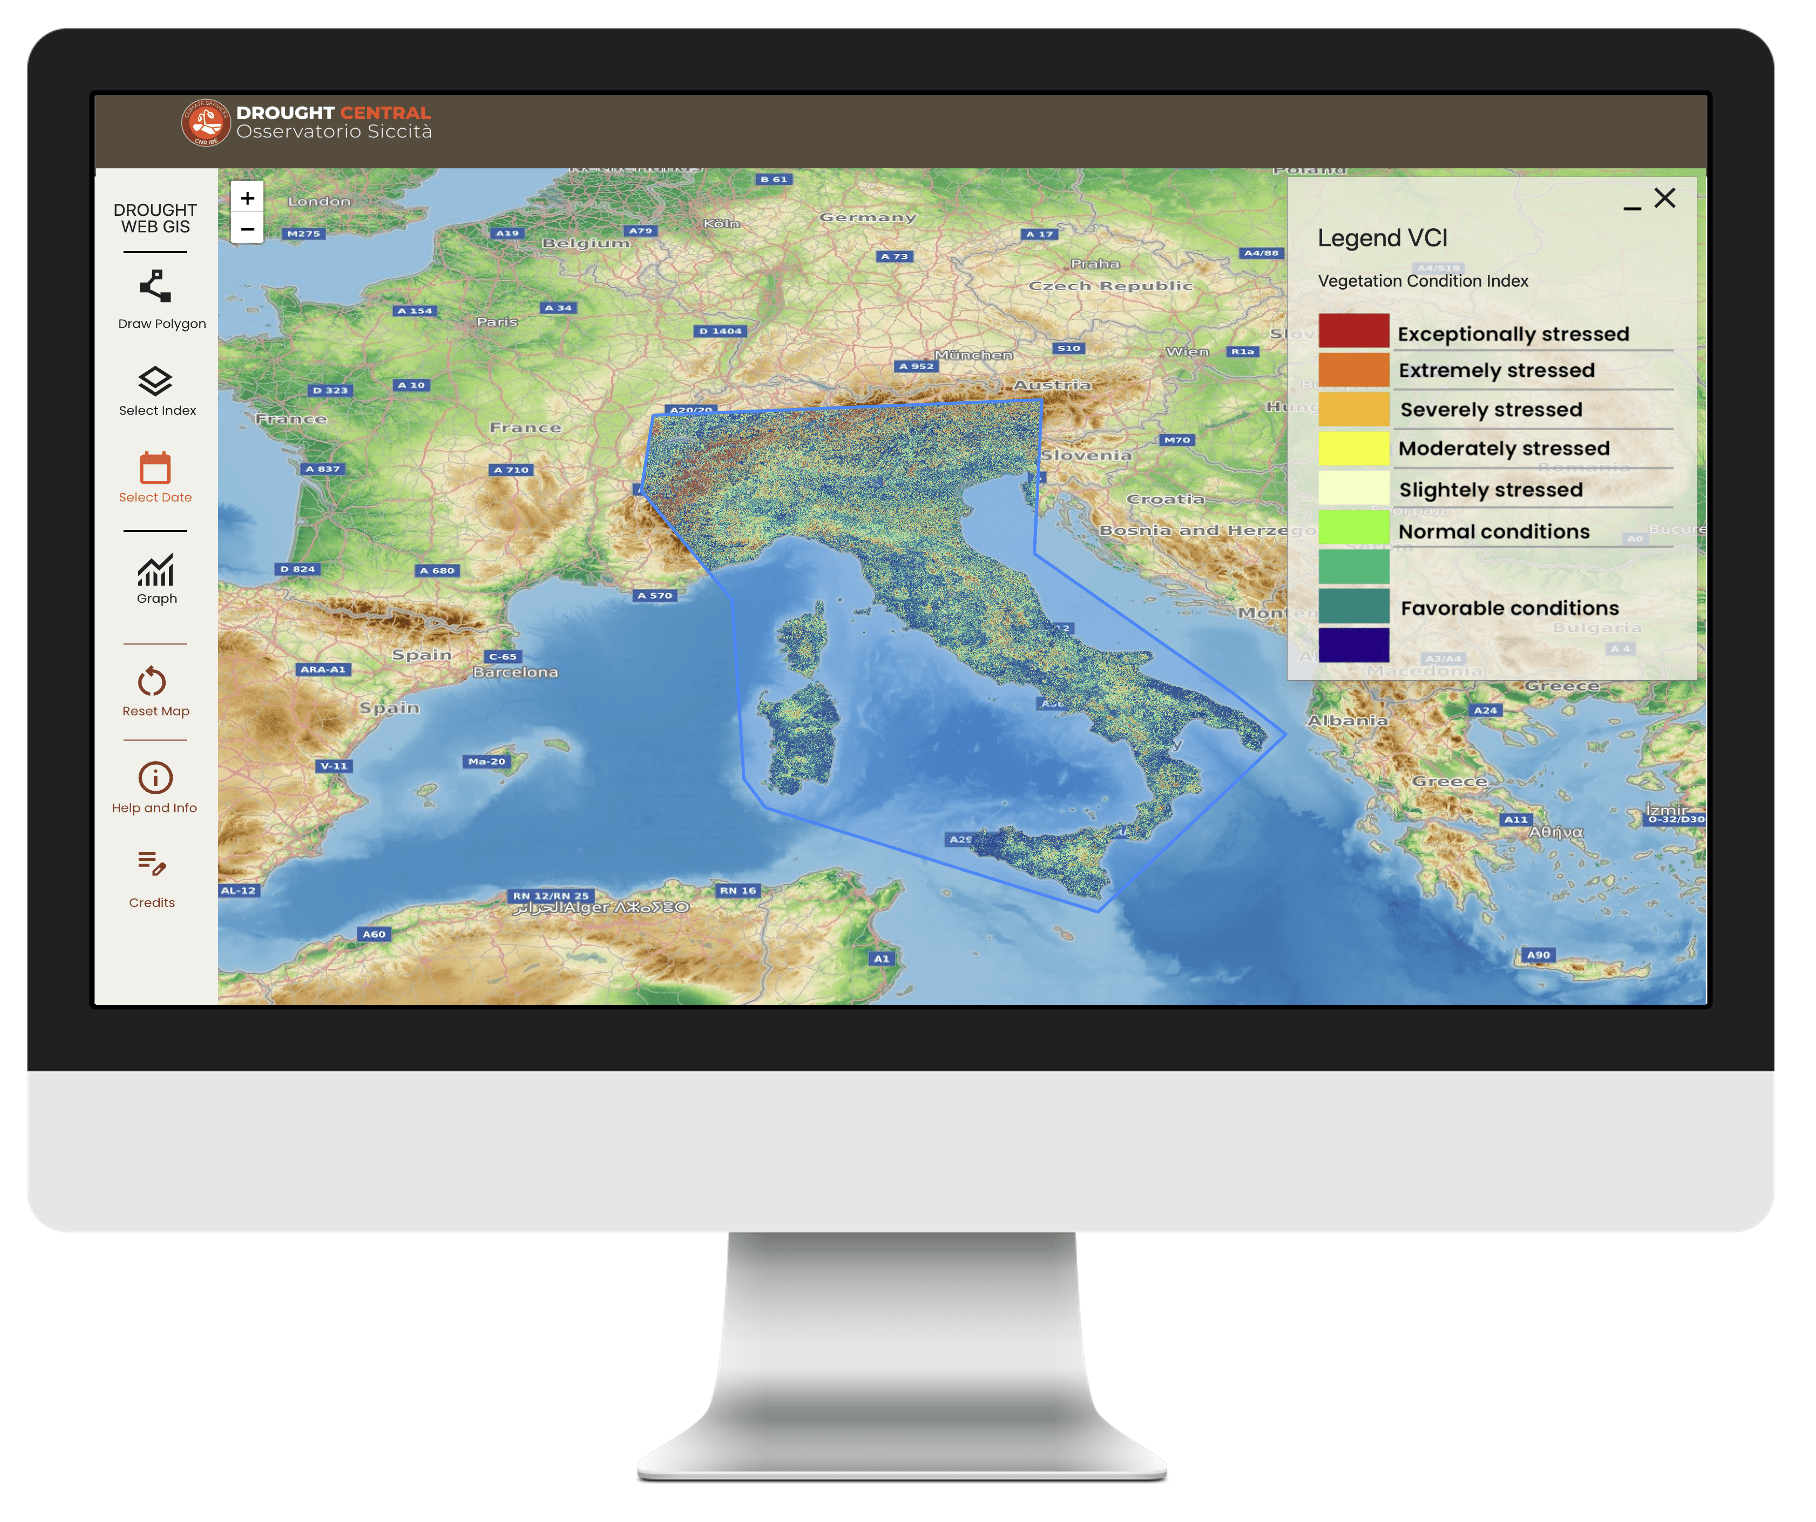
Please Note: Due to the size of the images, it is possible to download sections of the vegetation indices smaller than the whole geographic window.
Please Note: due to problems concerning the Terra MODIS satellite, the TCI and VHI indices are available until the 9th of November 2022. They will be replaced soon with new products.
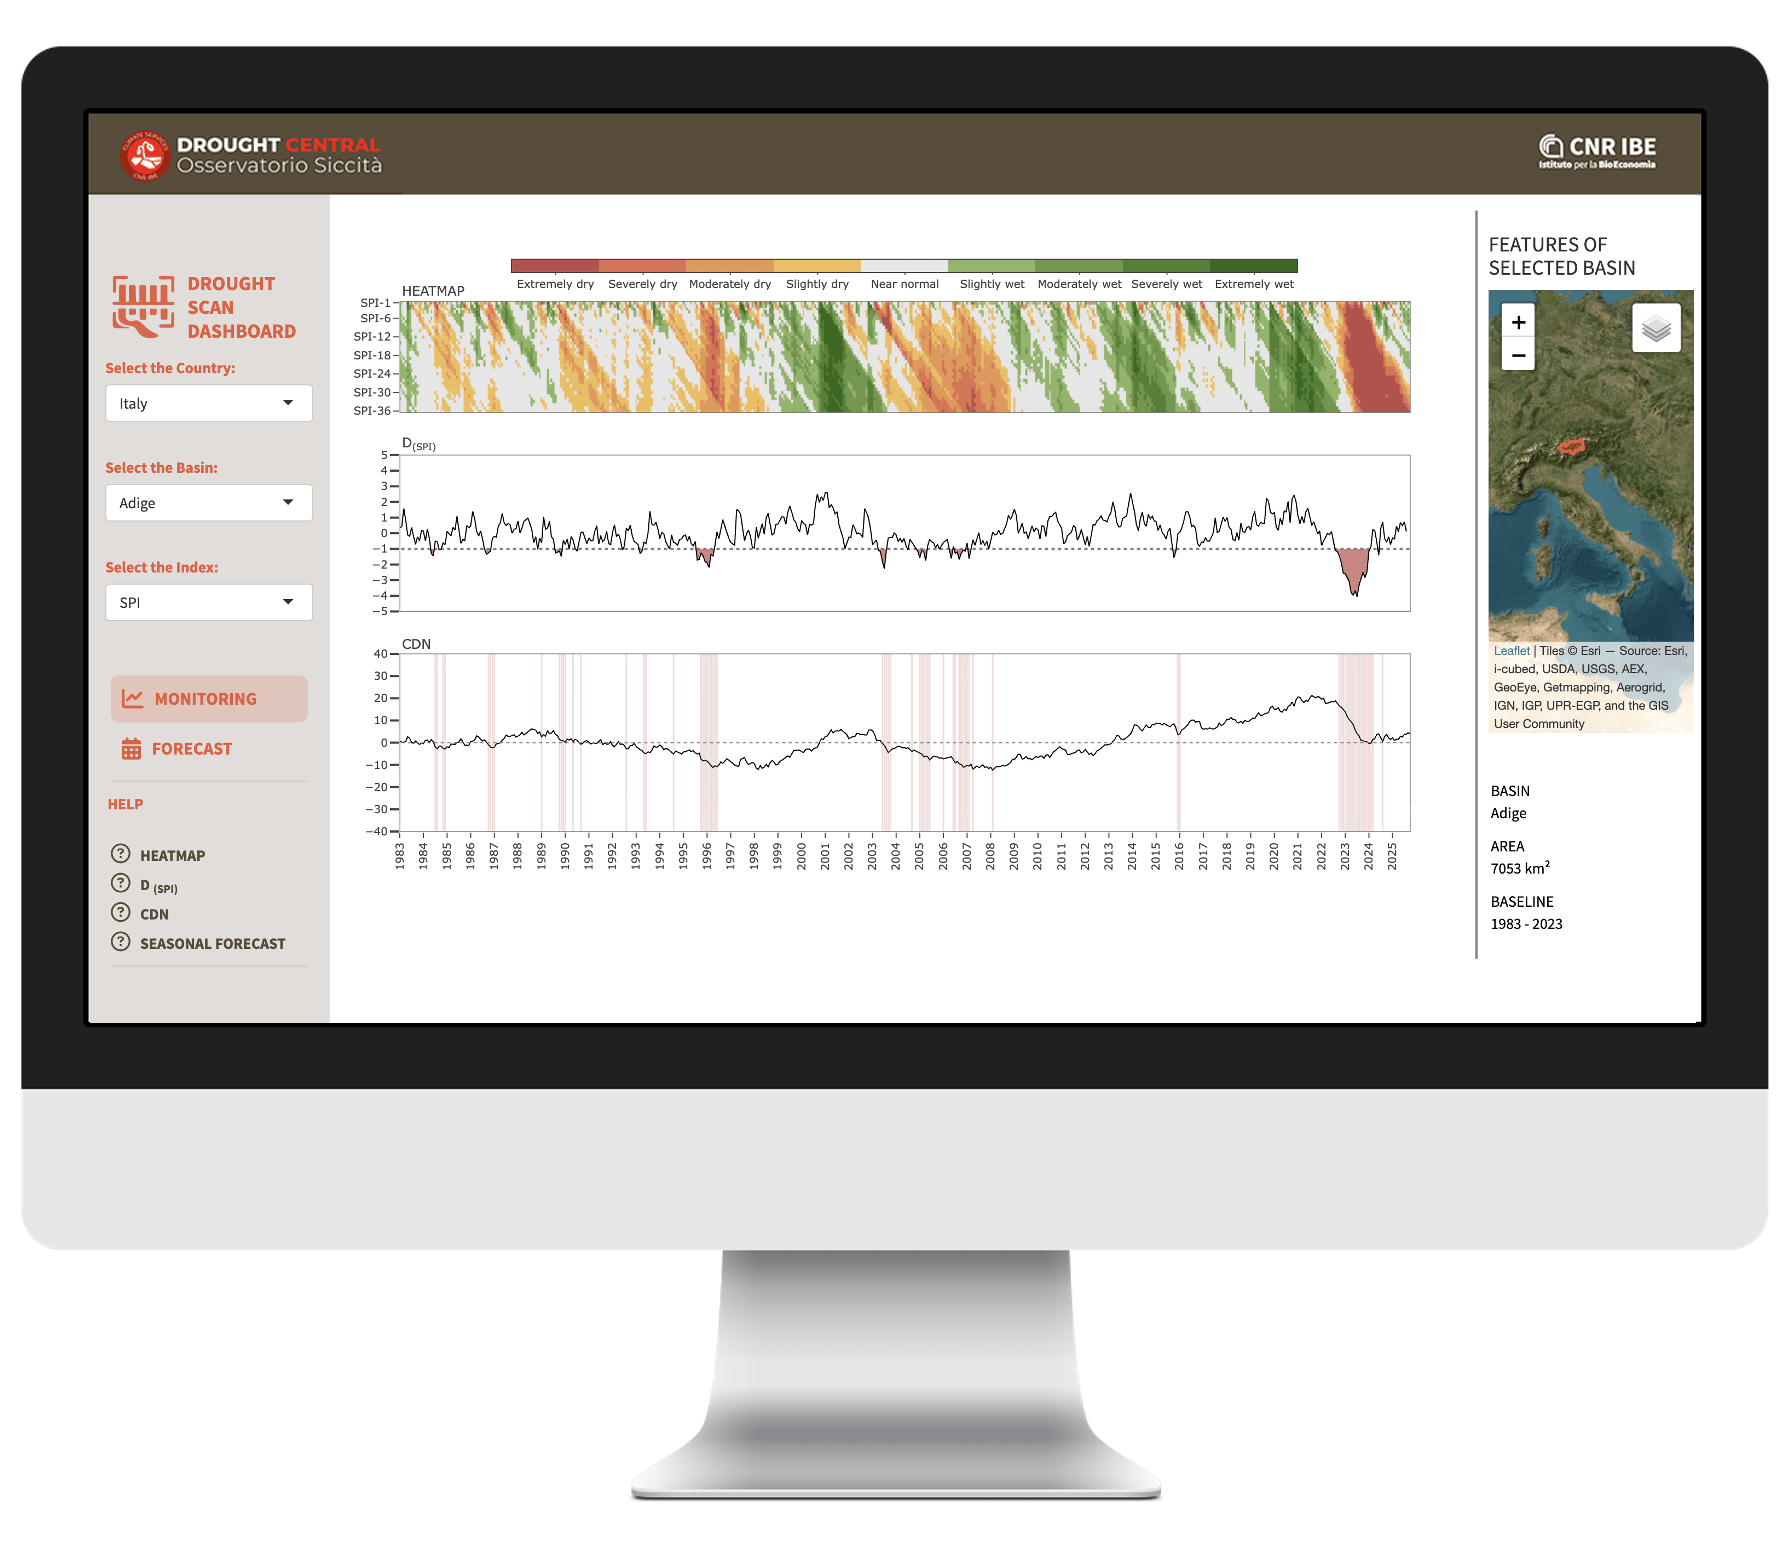
Drought Scan
The Drought Scan (DS) is an operational climate service for users with different profiles — technicians, researchers, irrigation consortia, and water authorities — who need a clear, consistent, and scalable assessment of drought conditions at the river-basin scale, using tools that are easy to use yet scientifically robust.
For further information, visit the dedicated page.

Drought
is a complex phenomenon
The challenge
Increasing environmental resilience
A Scientific Proactive approach
Technical support and timely information
A frequent phonomenon
After flooding, it is the second natural disaster that affects the population.
Long term impact
The impact on the environment and human activities can show up late and persist even after the end of the drought event.
High variability
Its intensity and spatial extent are extremely variable.
A creeping phenomenon
With respect to other natural extreme events, drought is characterised by a slow and often difficult to define onset and a long-lasting evolution.
Drought Observatory: the reason why
Drought monitoring and forecasting system
Integration of ground-based and satellite data
The Indices: Drought occurrences and trends
- direct climate-based indices.
- indirect vegetation-based indices

Spatial Data Infrastructure
SOA | OGC | PostgreSQL
A Service-Oriented Architecture (SOA) based on Open Geospatial Consortium (OGC) standards. Database-centred architecture, with PostgreSQL DataBase Management System.
Innovative Approach
The geographic data flows (from the download of remote sensing and climatic data to the storage of final indices) and all the related geoprocessing functions are integrated in a single environment.
Advanced Statistical Procedures
The integration of the PL/R (R Procedural Language) wrapper into the procedural language of PostgreSQL (PL/pgSQL) allowed the creation of advanced statistical procedures using R engine.